Monitor git sync or s3 sync failure
This how-to will walk you through the steps to view git sync/s3 failures in Grafana.
Step 1
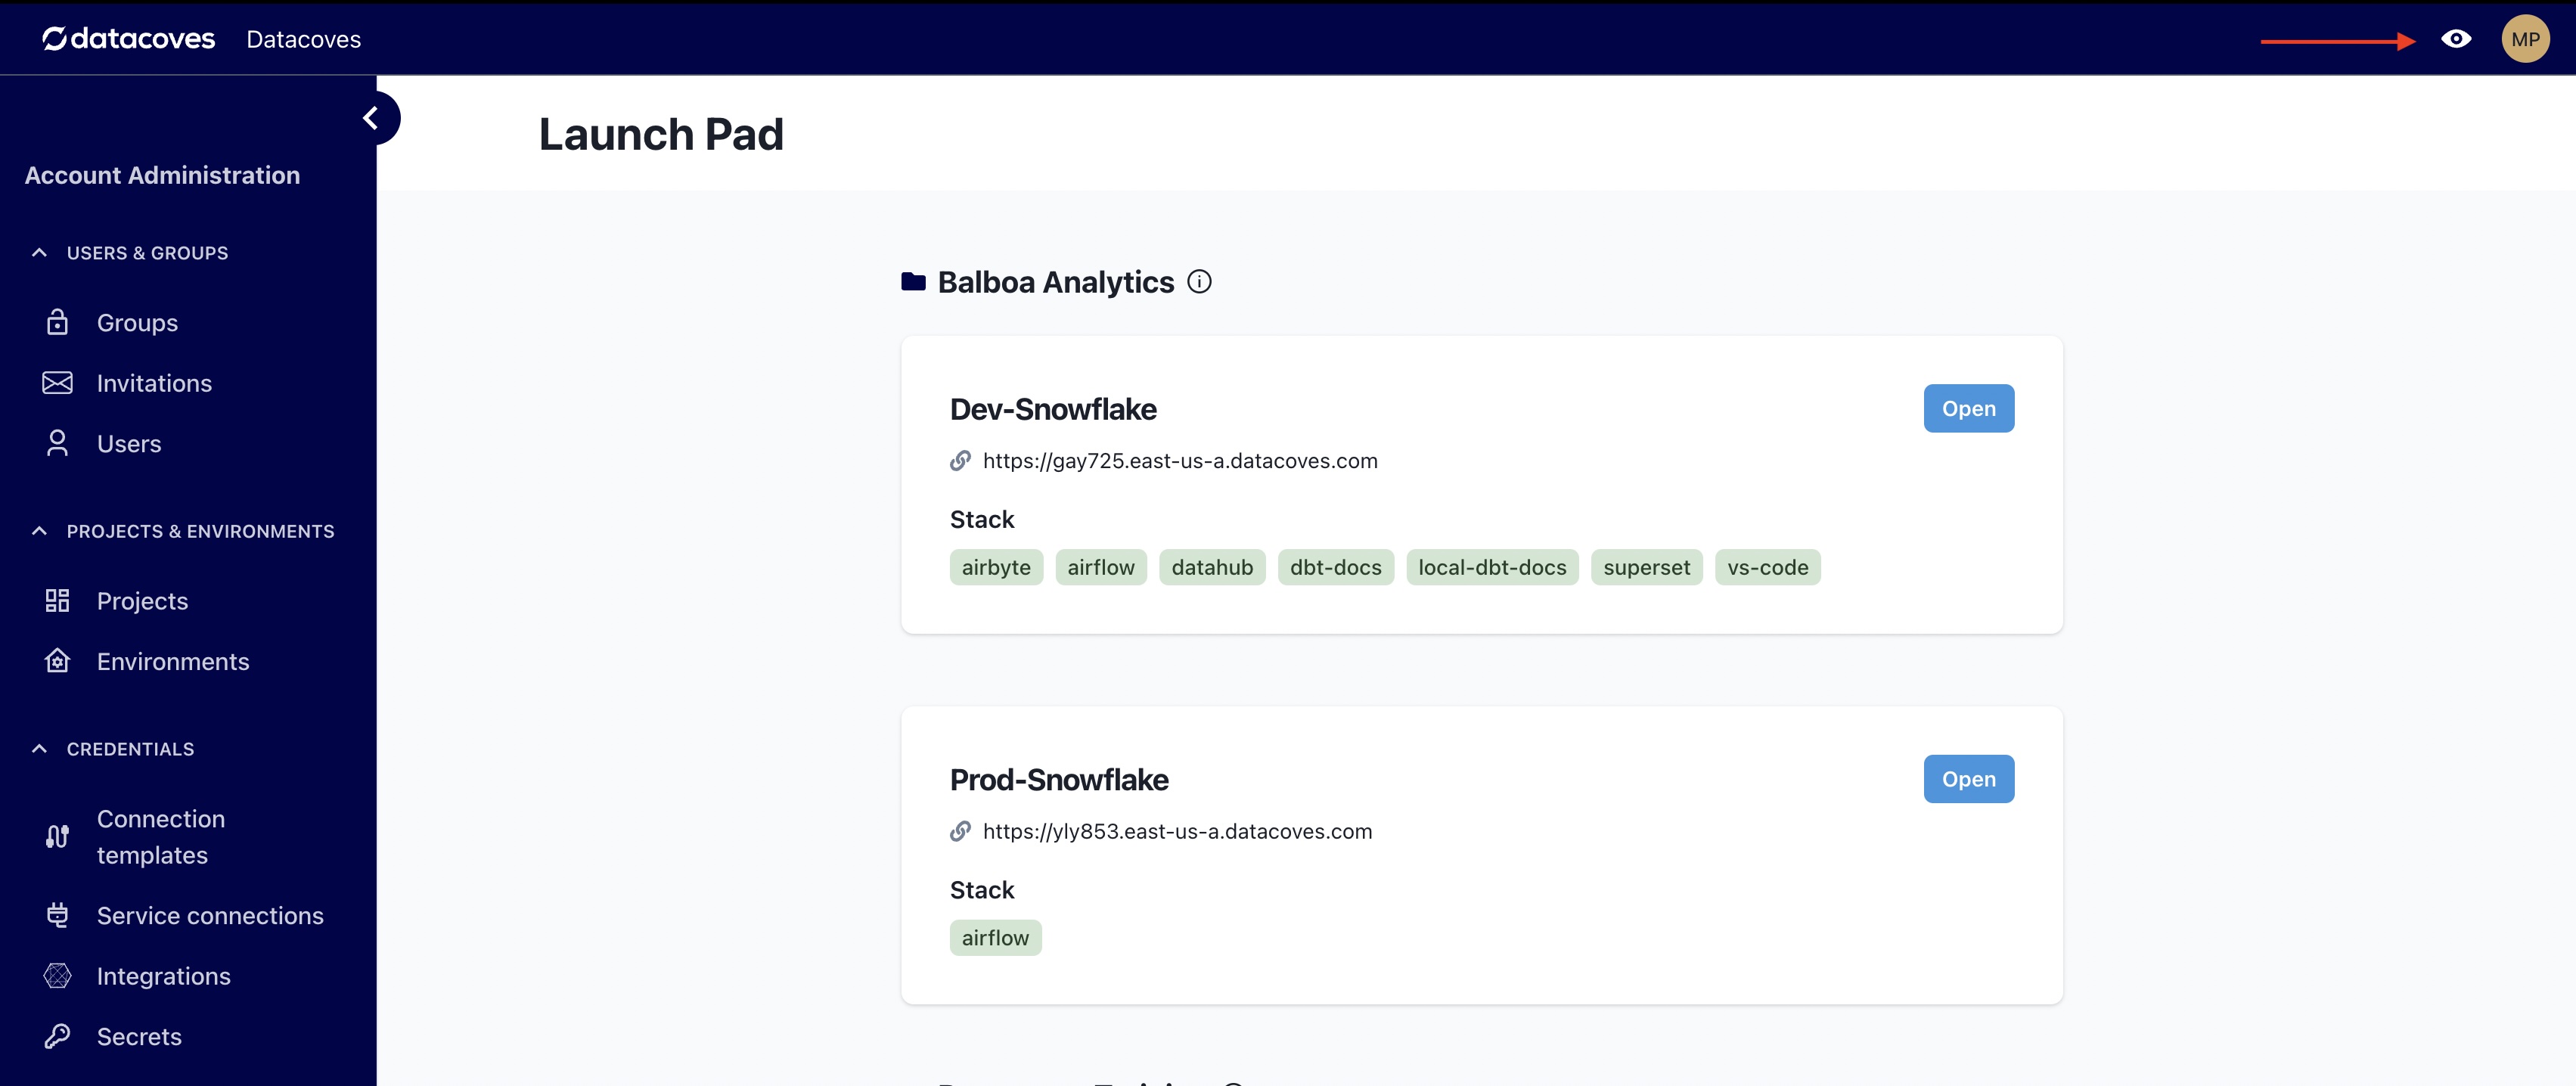
A user with Grafana access can navigate to the Grafana UI by clicking on the Eye icon in the top right corner of the Datacoves UI.
Step 2
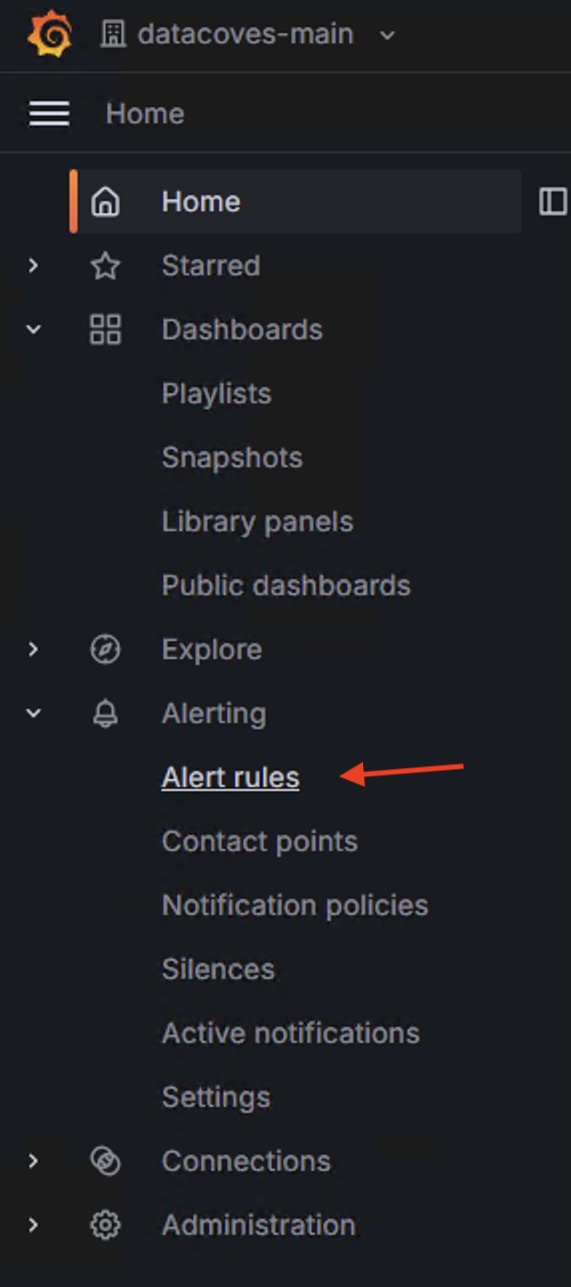
Navigate to Alerting and select Alerting rules.
Step 3
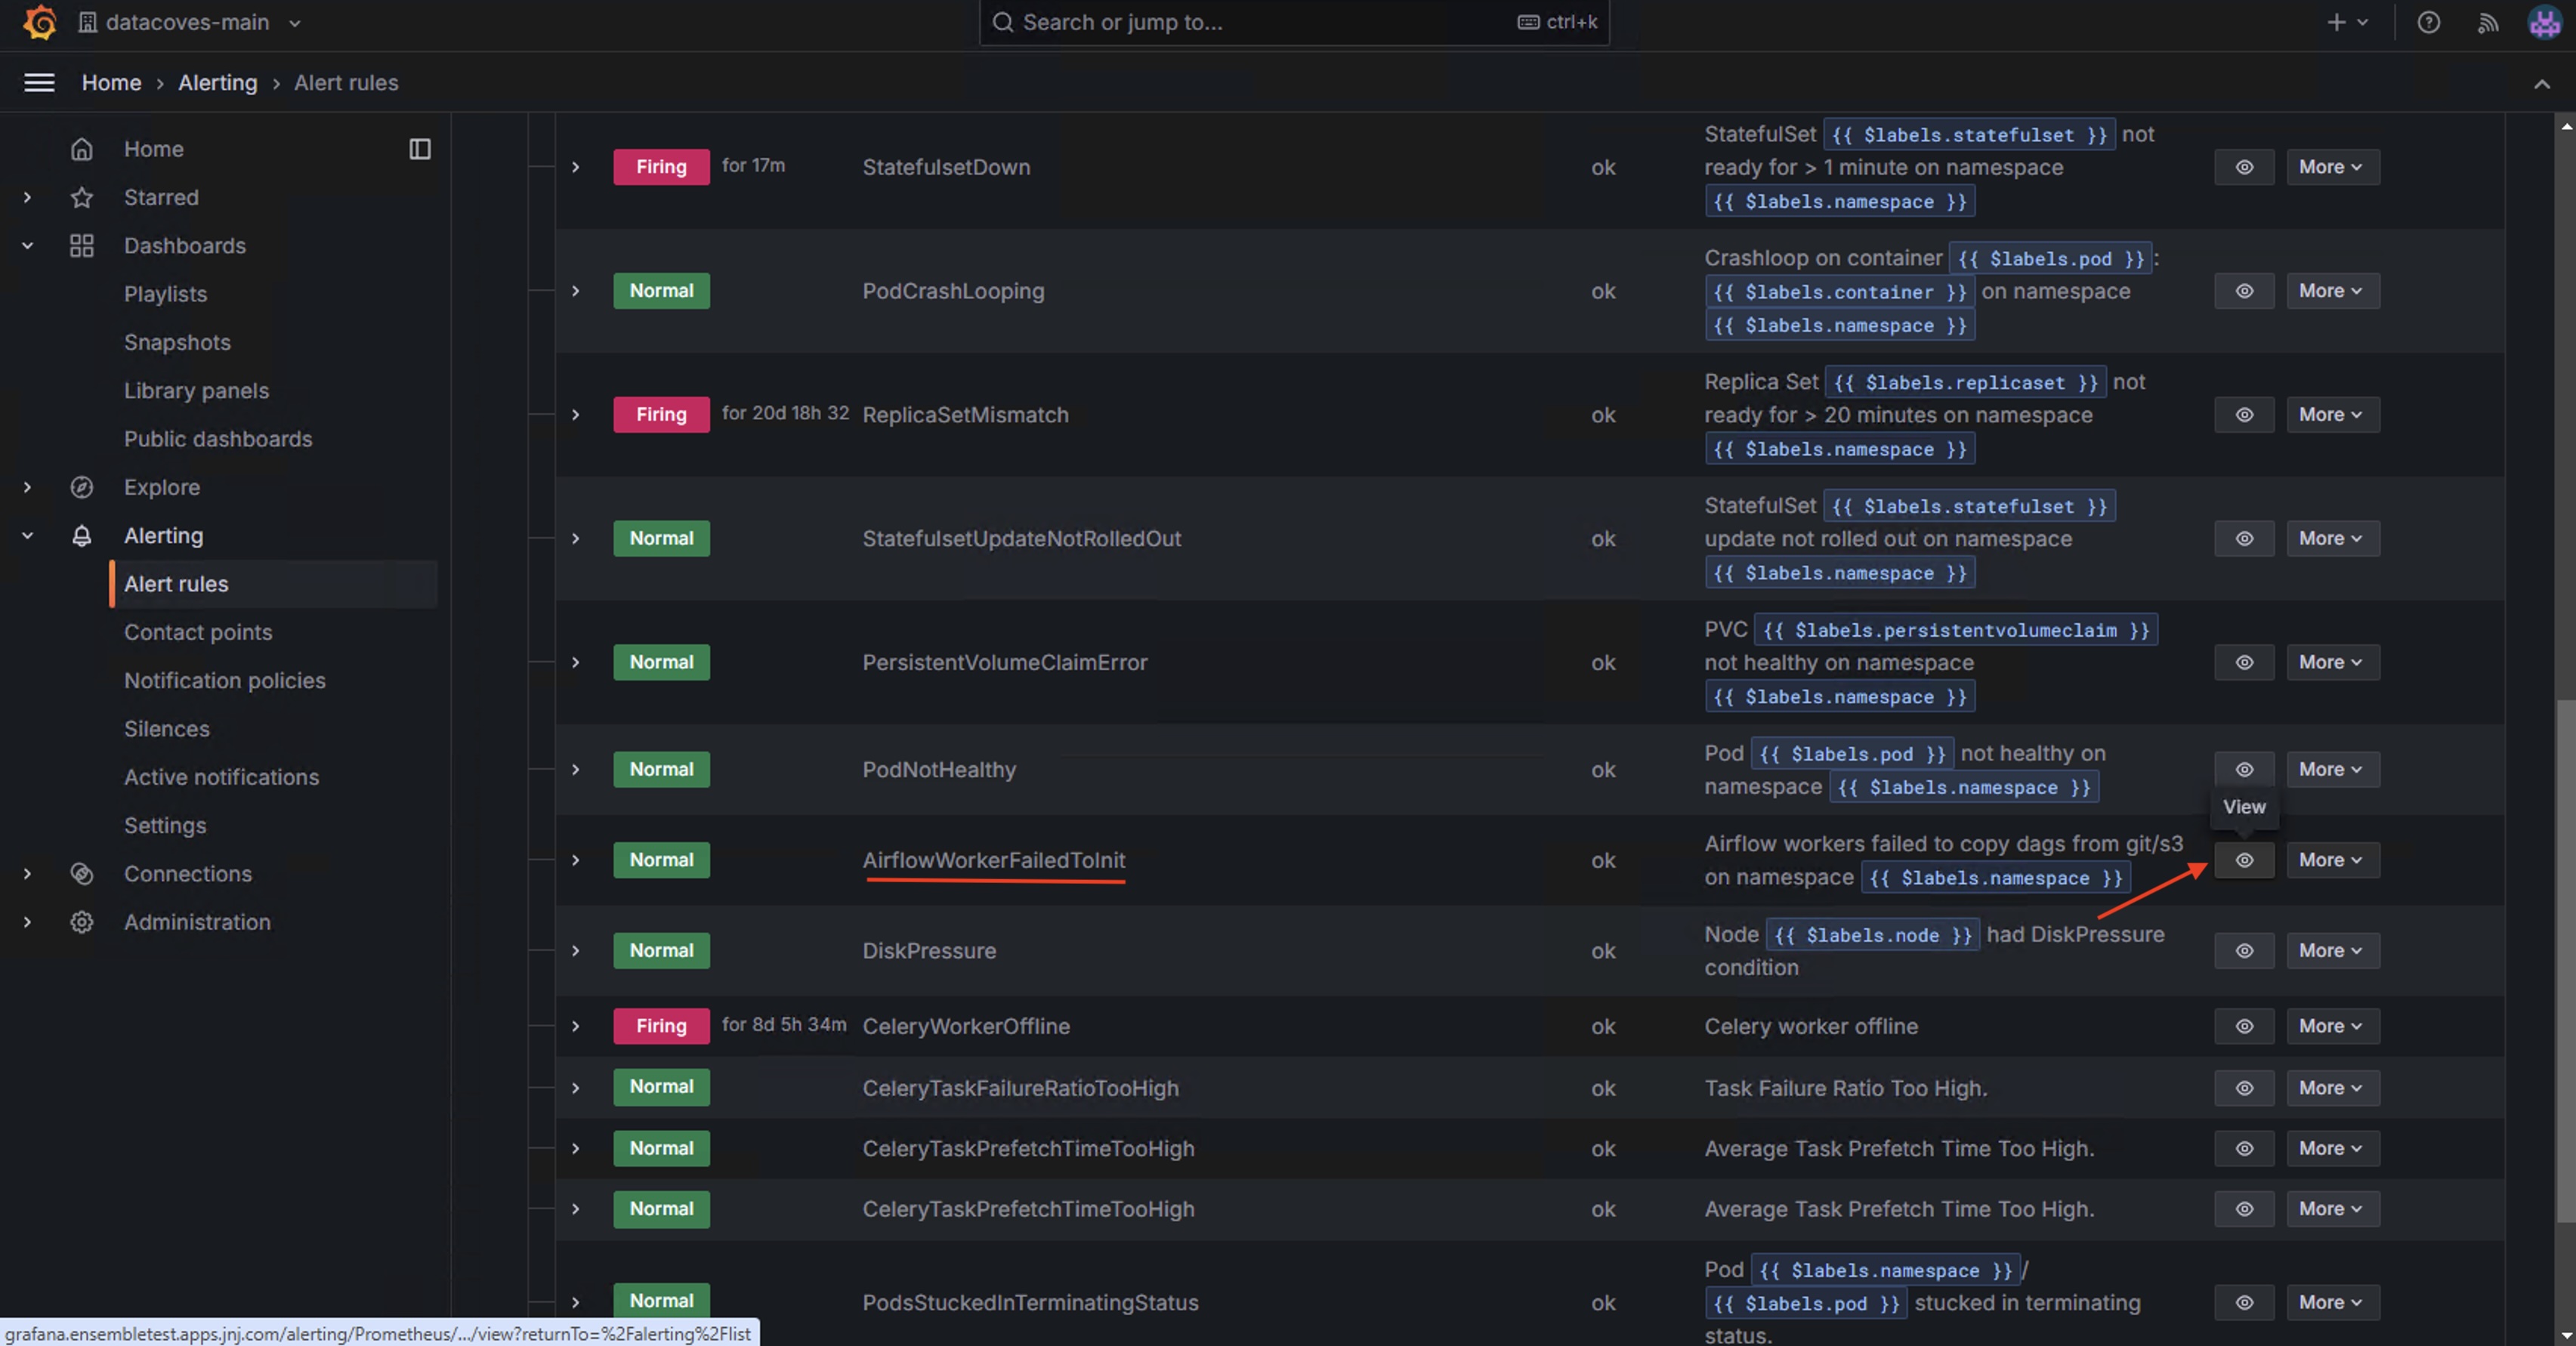
Expand the folder under Mimir/Cortex/Loki and select the view icon on the AirflowWorkerFailedToInit rule.
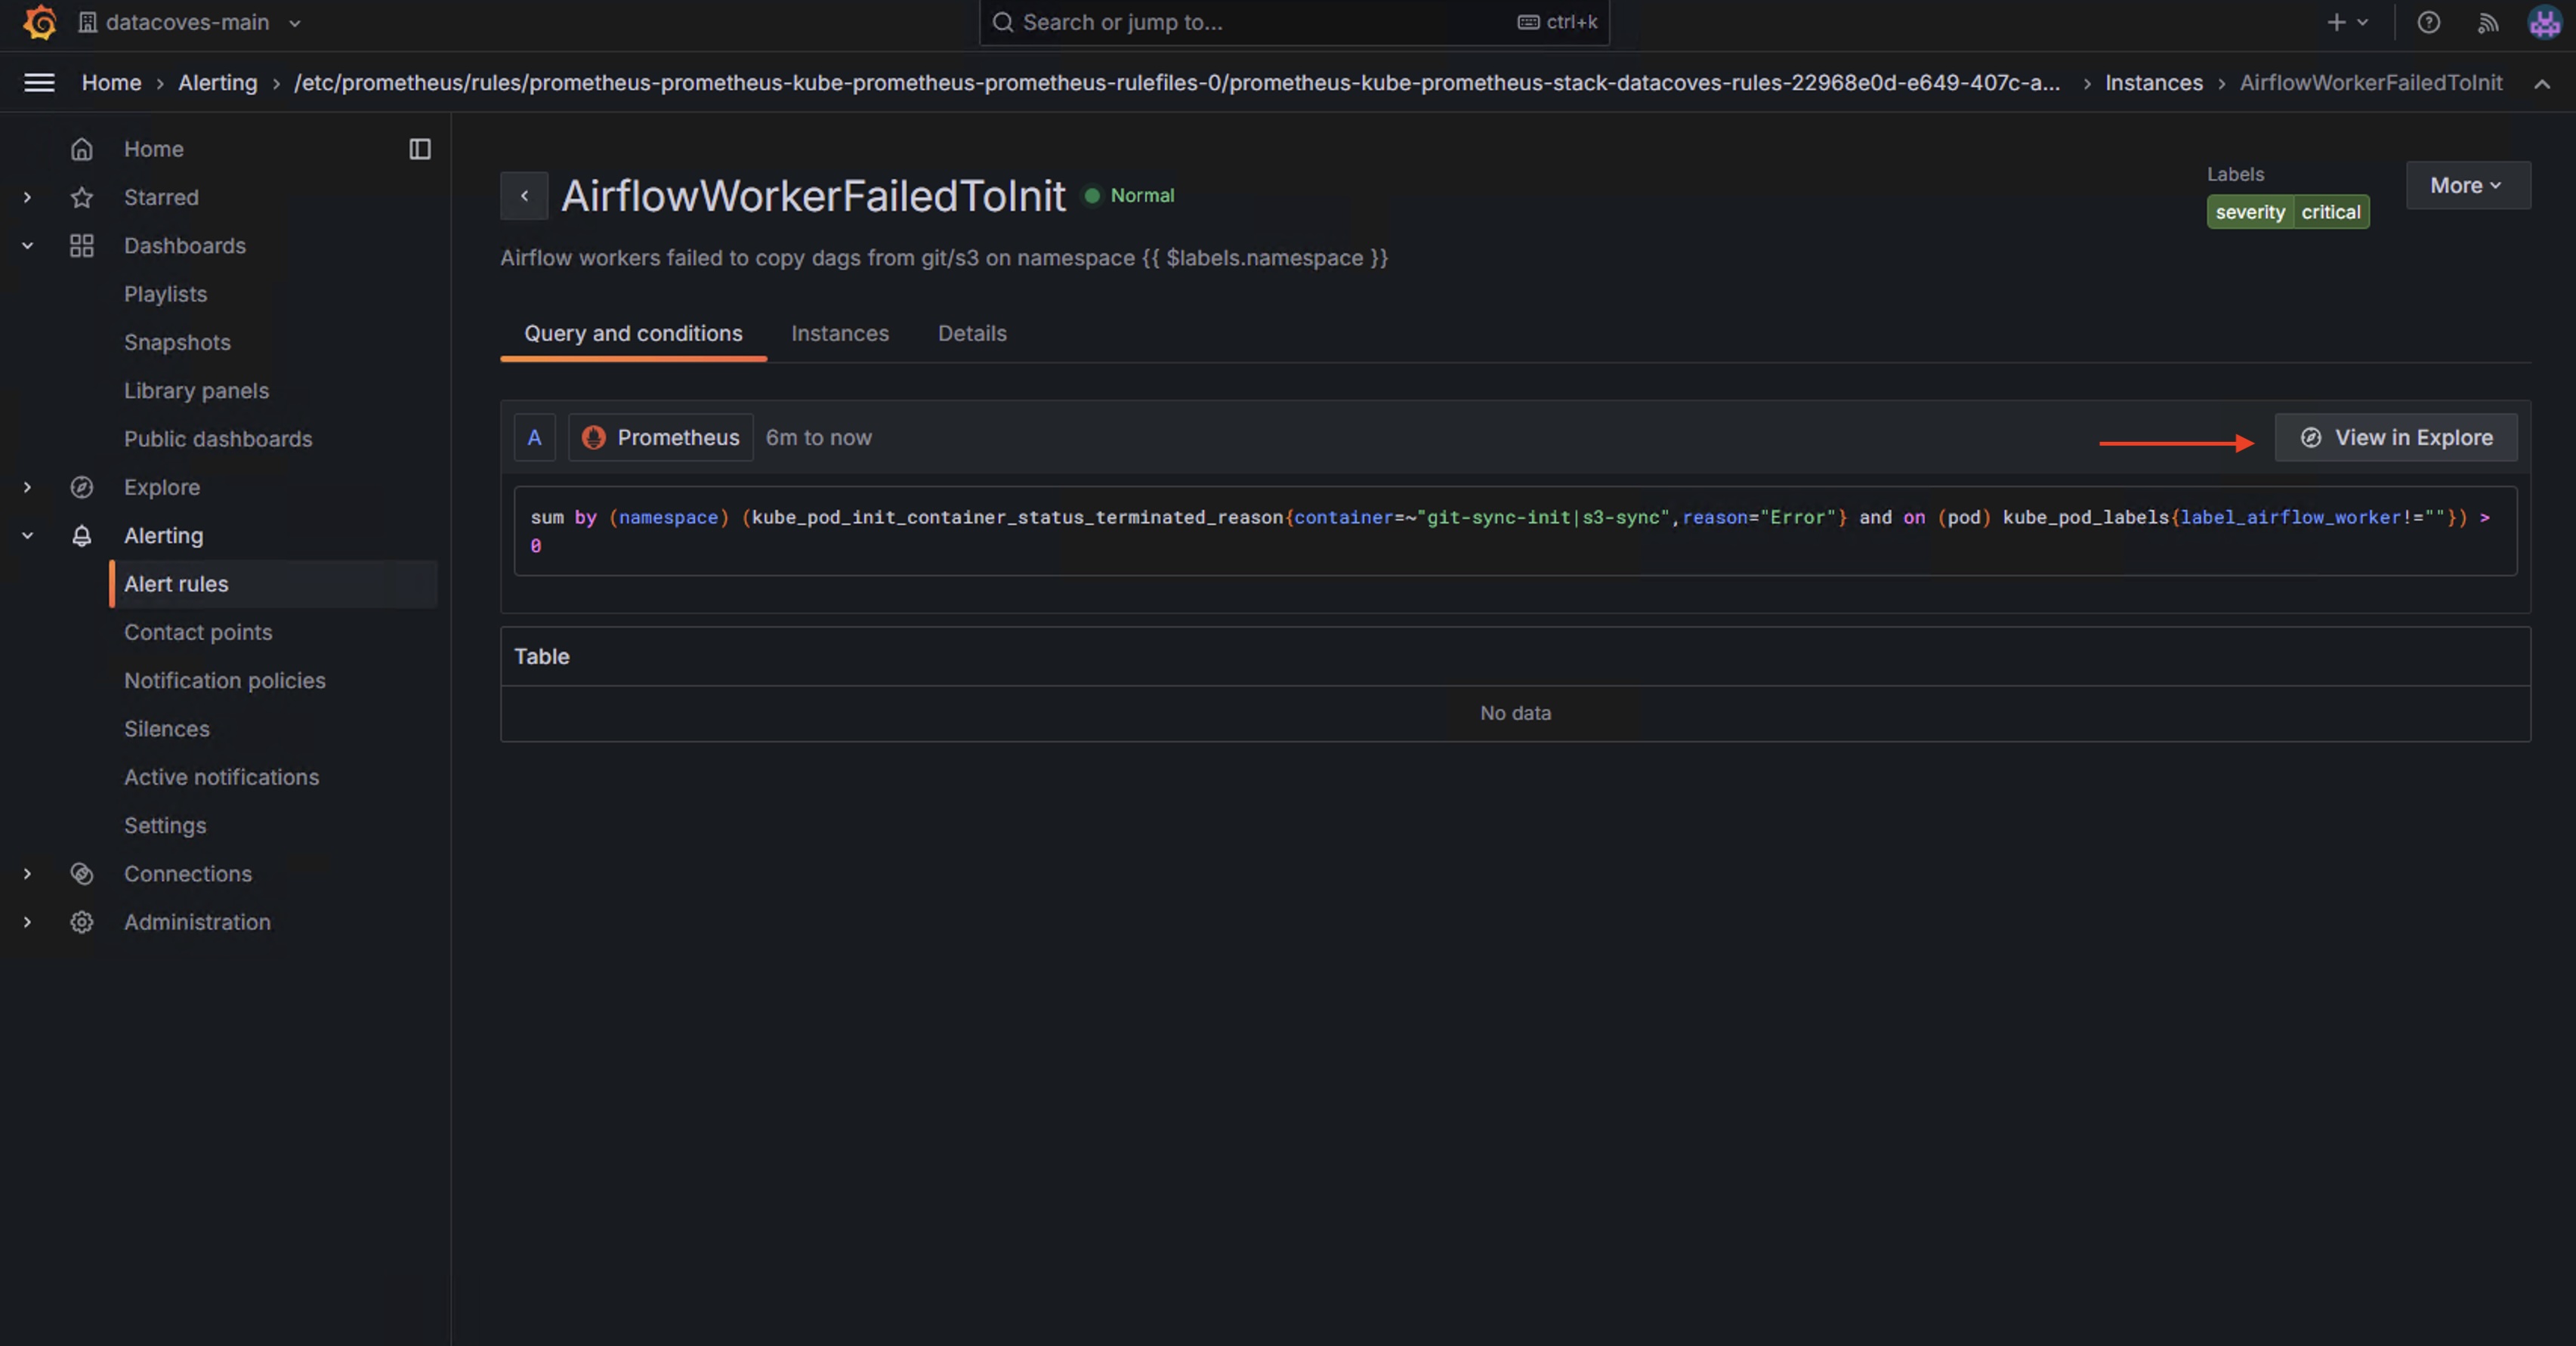
Step 4
Select View in Explorer to see the Graph and other information.