MCP Servers
Datacoves can connect your AI coding assistants to live data systems through MCP (Model Context Protocol) servers. An MCP server gives an AI tool structured, read access to an external system so it can answer questions grounded in your real data instead of guessing.
Datacoves ships four MCP servers:
| Server | What it exposes | User setup |
|---|---|---|
| GitHub | Your repositories, pull requests, issues, and CI checks | A GitHub personal access token |
| Airflow | Your DAGs, runs, and task logs (read-only) | None |
| Grafana (Prometheus & Loki) | Metrics and logs from your environment | None |
| Snowflake | Your Snowflake data and metadata, through read-only SQL | An MCP server created in your Snowflake account |
Once enabled, the GitHub, Airflow, Grafana, and Snowflake servers are available to every AI tool in your workspace:
- Datacoves Copilot
- GitHub Copilot
- OpenAI Codex
- Snowflake Cortex
The Snowflake server also reaches Claude Code, the extension and the CLI, and the GitHub Copilot CLI.
Enabling MCP servers
MCP servers are toggled per environment by an administrator.
You need admin access to enable MCP servers. Go to Admin > Environments, edit the environment, open the AI Tools tab, and turn on the servers you want under MCP Servers.
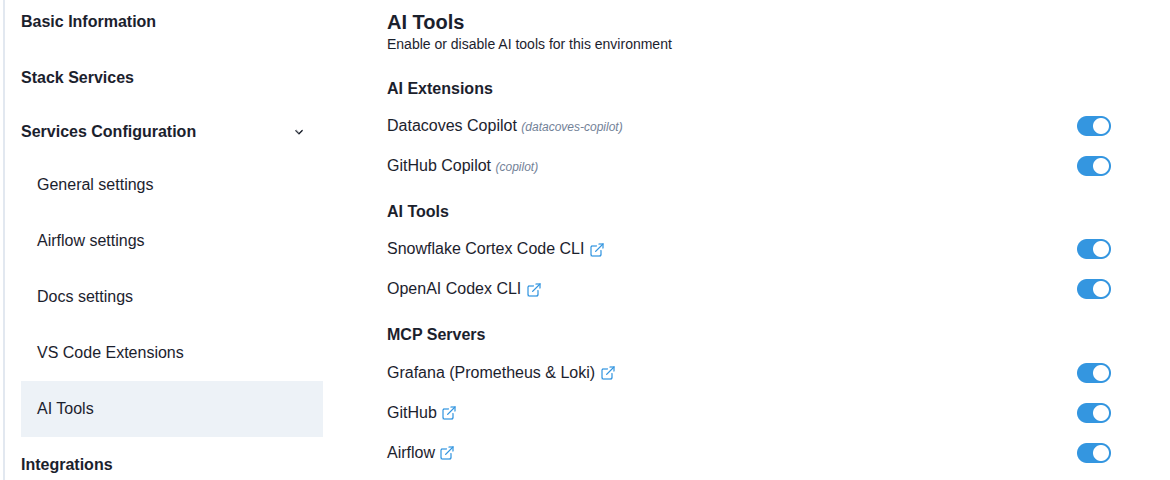
After a server is enabled, it appears automatically in each AI tool the next time the workspace starts. No further configuration is needed in the tools themselves.
The Grafana (Prometheus & Loki) toggle only appears when the observability stack is enabled for your cluster. Contact Datacoves support if you do not see it.
What you can ask
Each server page includes example prompts. A few to get started:
- GitHub: "Check my last pull request and explain why the CI check failed."
- Airflow: "Check the log of the task that failed in my last DAG run and recommend a fix."
- Grafana: "Query the metrics and logs for my environment and summarize recent failures."
- Snowflake: "Which columns does the customers table have, and how many rows are in it?"