Grafana Dashboards
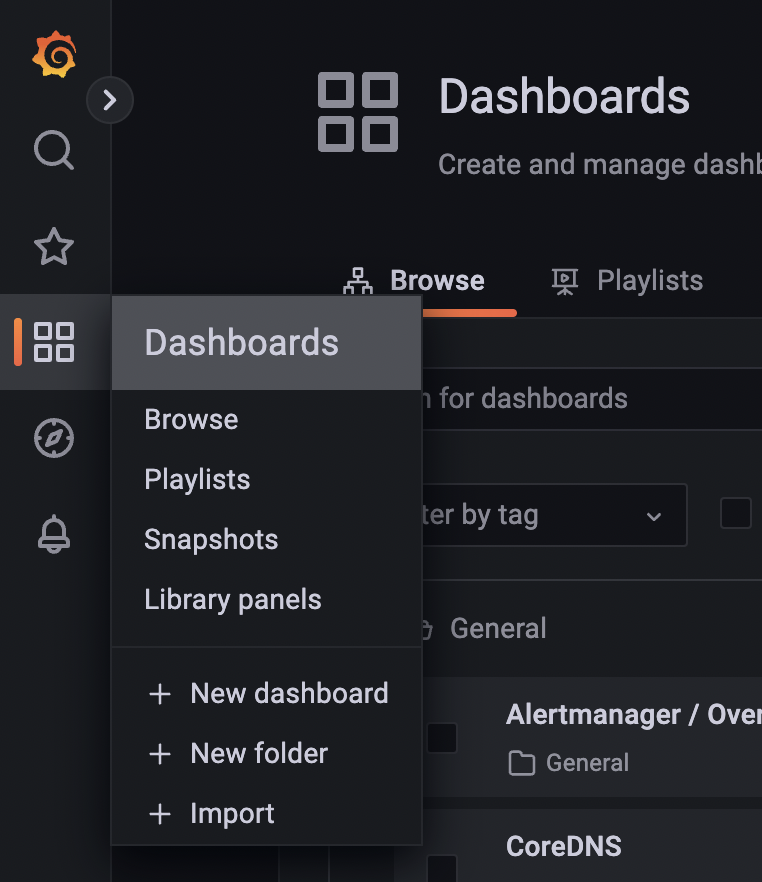
Navigation menu
Accessing the dashboards list is easy:
Tip
We recommend you bookmark your favorite dashboards so they are pinned in the home page.
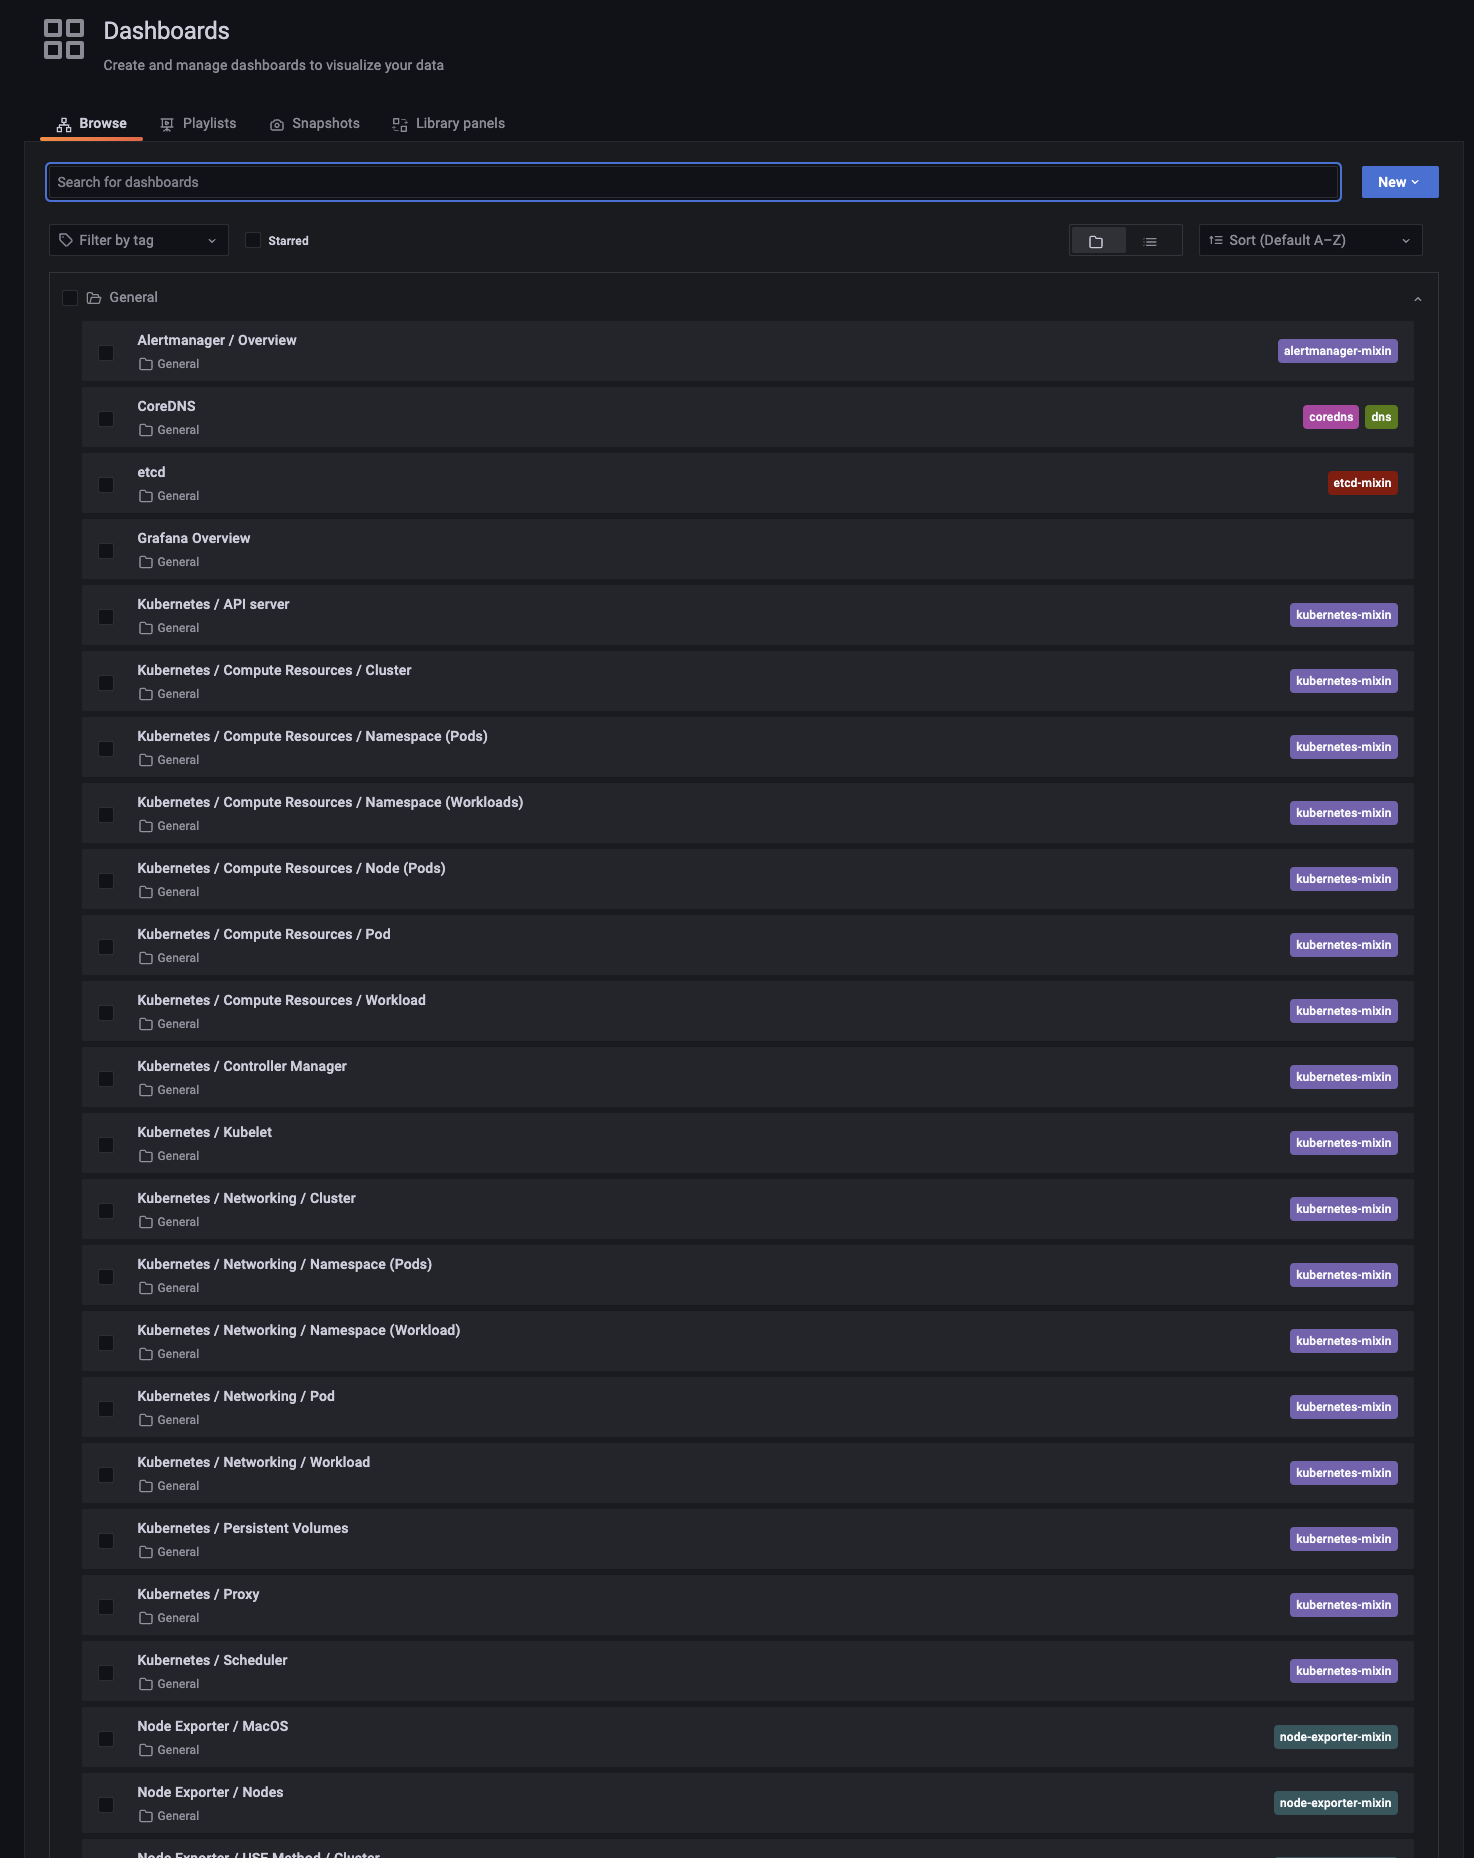
Prebuilt dashboards
Grafana comes with a set of prebuilt dashboards that you can use right away.
Attention
The following dashboards are not working quite right yet, so please don't use them:
. etcd
. Kubernetes / Compute Resources / Namespace (Workloads)
. Kubernetes / Compute Resources / Node (Pods)
. Kubernetes / Compute Resources / Workload
. Kubernetes / Controller Manager
. Kubernetes / Proxy
. Kubernetes / Scheduler
. Node Exporter / (all)